Spatial Aggregation & Areal Interpolation

Today

  1. The problem β€” data in the wrong zones
  2. Support β€” what does a value attached to a polygon mean?
  3. Extensive vs. intensive β€” what happens when you split a geometry?
  4. Areal interpolation in R β€” st_interpolate_aw() and st_agr()
  5. Limitations β€” when the uniform assumption fails; dasymetric mapping

The Problem

Data in the wrong zones

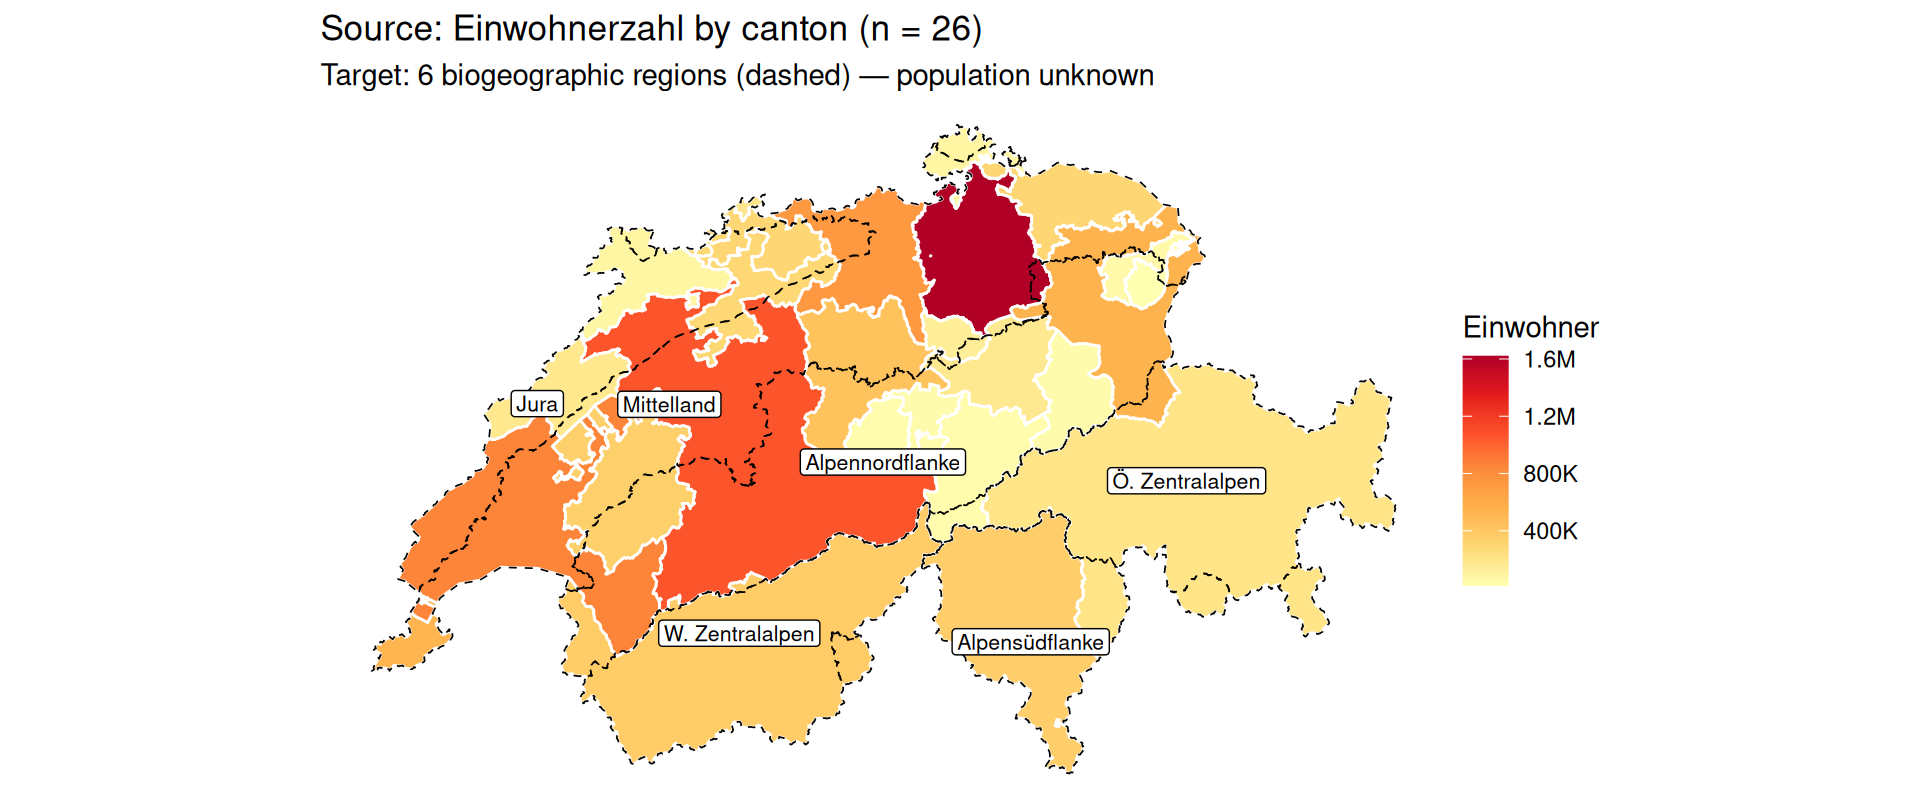
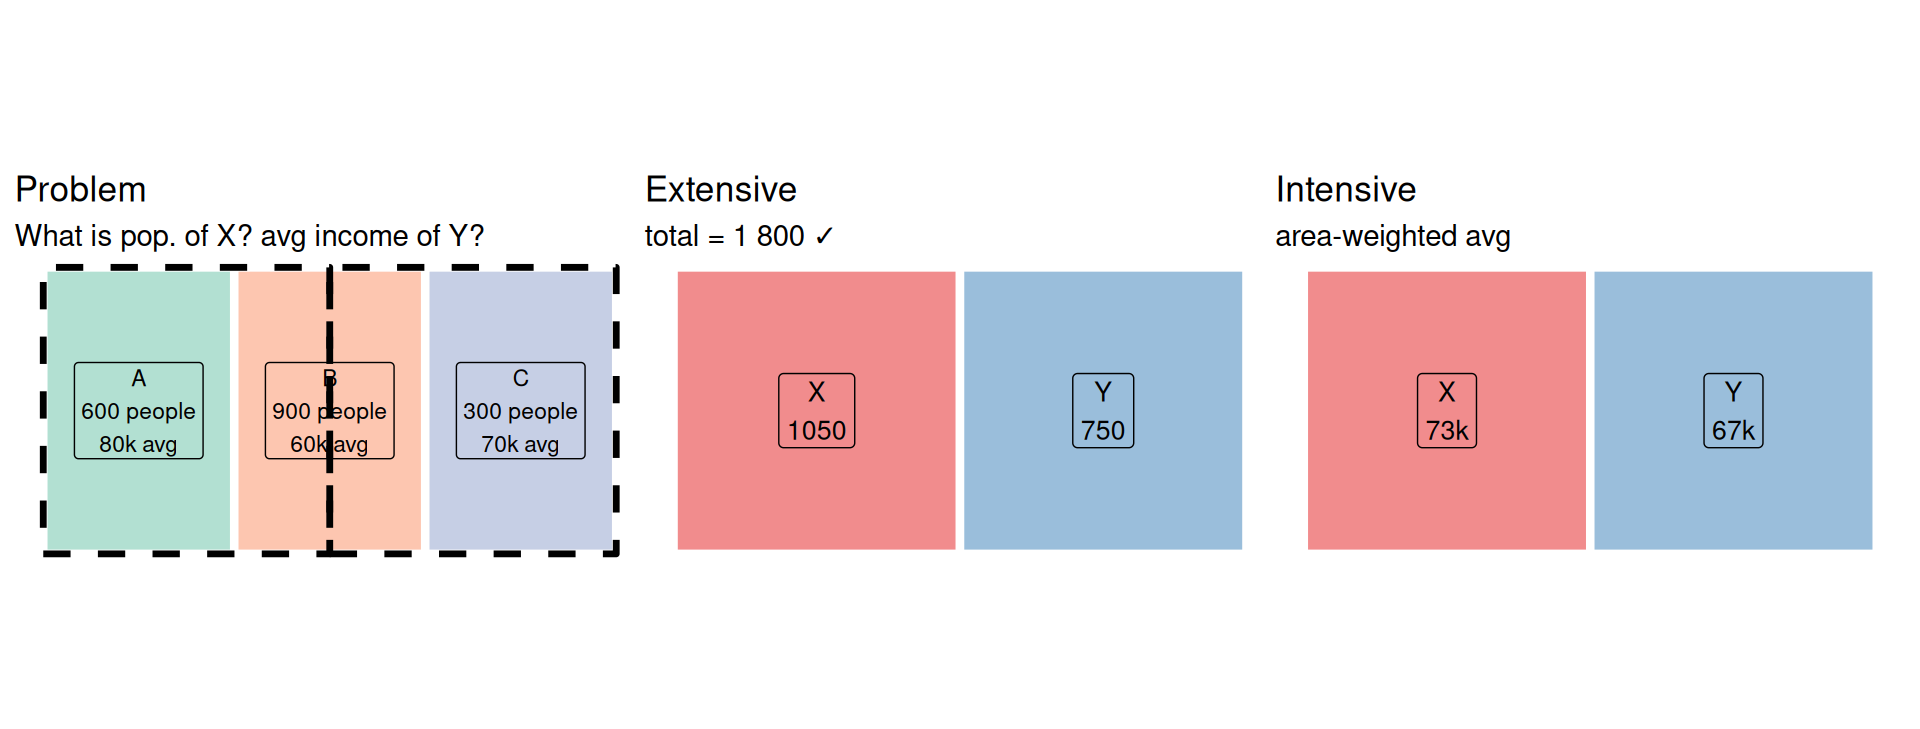
You have data β€” but the zones don’t match what you need:

  • Population by canton, but you need it by biogeographical region
  • Income by census tract, but you need it by school district

The source zones and target zones overlap in arbitrary ways. You cannot simply reassign values β€” you have to redistribute them.

Areal interpolation is the second largest source of error in spatial data science.

Edzer Pebesma - Areal interpolation methods - useR! 2026

The core challenge

Support

Q1: What does the value refer to?

Before you can redistribute a variable, you need to know what it represents.

  • Point support β€” the value refers to each individual location: E.g. Land cover, soil type
  • Block support β€” the value refers to the whole geometry as a unit: E.g. Population count, average income

Why support matters

  • For point-support variables: you can query any sub-region directly. A raster crop, a spatial filter, a point-in-polygon lookup β€” all valid.
  • For block-support variables: the value only makes sense for the whole geometry. Splitting it requires an assumption about how the variable is distributed within the polygon.
    • The simplest assumption: uniform distribution β€” the variable is spread evenly across the area.
    • This assumption is almost never true

Extensive vs. Intensive

For Block support

Q2: What happens when you cut a polygon in half?

Question: does the value sum across sub-regions, or does it stay constant?

Variable Cut in half β†’ Type
Population count (1 000) ~500 each Extensive
Population density (50/kmΒ²) still 50/kmΒ² each Intensive
Total household income (€200M) ~€100M each Extensive
Average household income (€60k) still €60k each Intensive
Number of schools (12) ~6 each Extensive
School density (2/kmΒ²) still 2/kmΒ² Intensive

Redistribution formulas

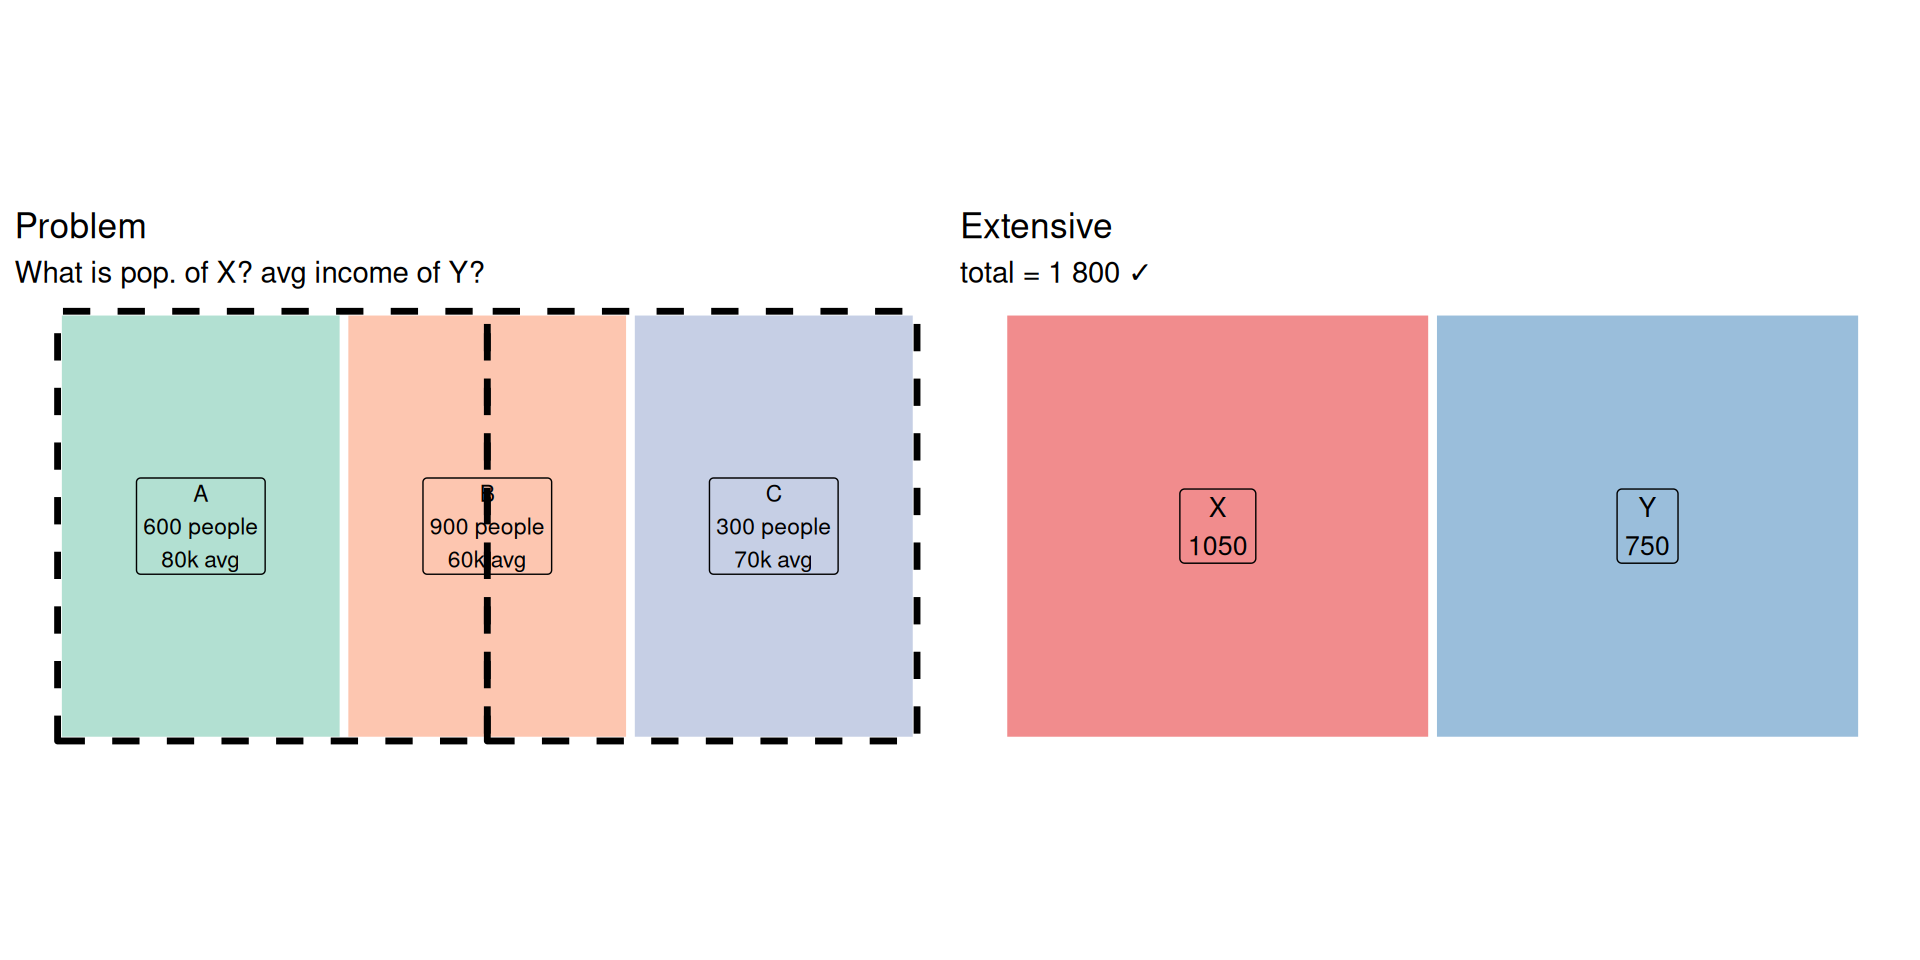
Extensive (counts, totals β€” the sum must be preserved):

\[v_j = \sum_i v_i \cdot \frac{\text{area}(A_i \cap B_j)}{\text{area}(A_i)}\]

Each source value is split proportionally to the area of intersection.

Intensive (rates, densities, averages β€” no sum to preserve):

\[v_j = \frac{\displaystyle\sum_i v_i \cdot \text{area}(A_i \cap B_j)}{\displaystyle\sum_i \text{area}(A_i \cap B_j)}\]

Each source value is weighted by the intersection area, then averaged.

Areal Interpolation in R

st_interpolate_aw()

# extensive = TRUE  β†’  sum-preserving (counts, totals)
pop_by_target <- st_interpolate_aw(src["population"], tgt, extensive = TRUE)
Warning in st_interpolate_aw.sf(src["population"], tgt, extensive = TRUE):
st_interpolate_aw assumes attributes are constant or uniform over areas of x
Declaring attribute support: st_agr()

st_agr(src)                          # NA = undeclared
      zone population income_avg 
      <NA>       <NA>       <NA> 
Levels: constant aggregate identity
st_agr(src) <- c(population = "aggregate",   # block, summable  β†’ extensive = TRUE
                 income_avg = "constant")     # spatially constant β†’ extensive = FALSE
st_agr(src)
      <NA> population income_avg 
      <NA>  aggregate   constant 
Levels: constant aggregate identity
  • "aggregate" β€” block support, summable total: use extensive = TRUE
  • "constant" β€” spatially constant or rate: use extensive = FALSE

Setting this suppresses the warning and lets sf propagate attribute semantics correctly through operations like st_intersection().

# extensive = FALSE  β†’  area-weighted average (rates, densities)
inc_by_target <- st_interpolate_aw(src["income_avg"], tgt, extensive = FALSE)
inc_by_target$zone <- c("X", "Y")
inc_by_target$income_avg
[1] 73.33333 66.66667

Limitations

When the uniform assumption fails

The uniform distribution assumption is wrong whenever the variable is spatially heterogeneous within the source zone.

Examples:

  • Population in a municipality that is 80% forest β†’ people cluster in villages, not forest
  • Income data for a large canton β†’ urban and rural areas have very different incomes
  • Large source zones intersecting many small target zones β†’ fine-grained heterogeneity is lost

Dasymetric mapping

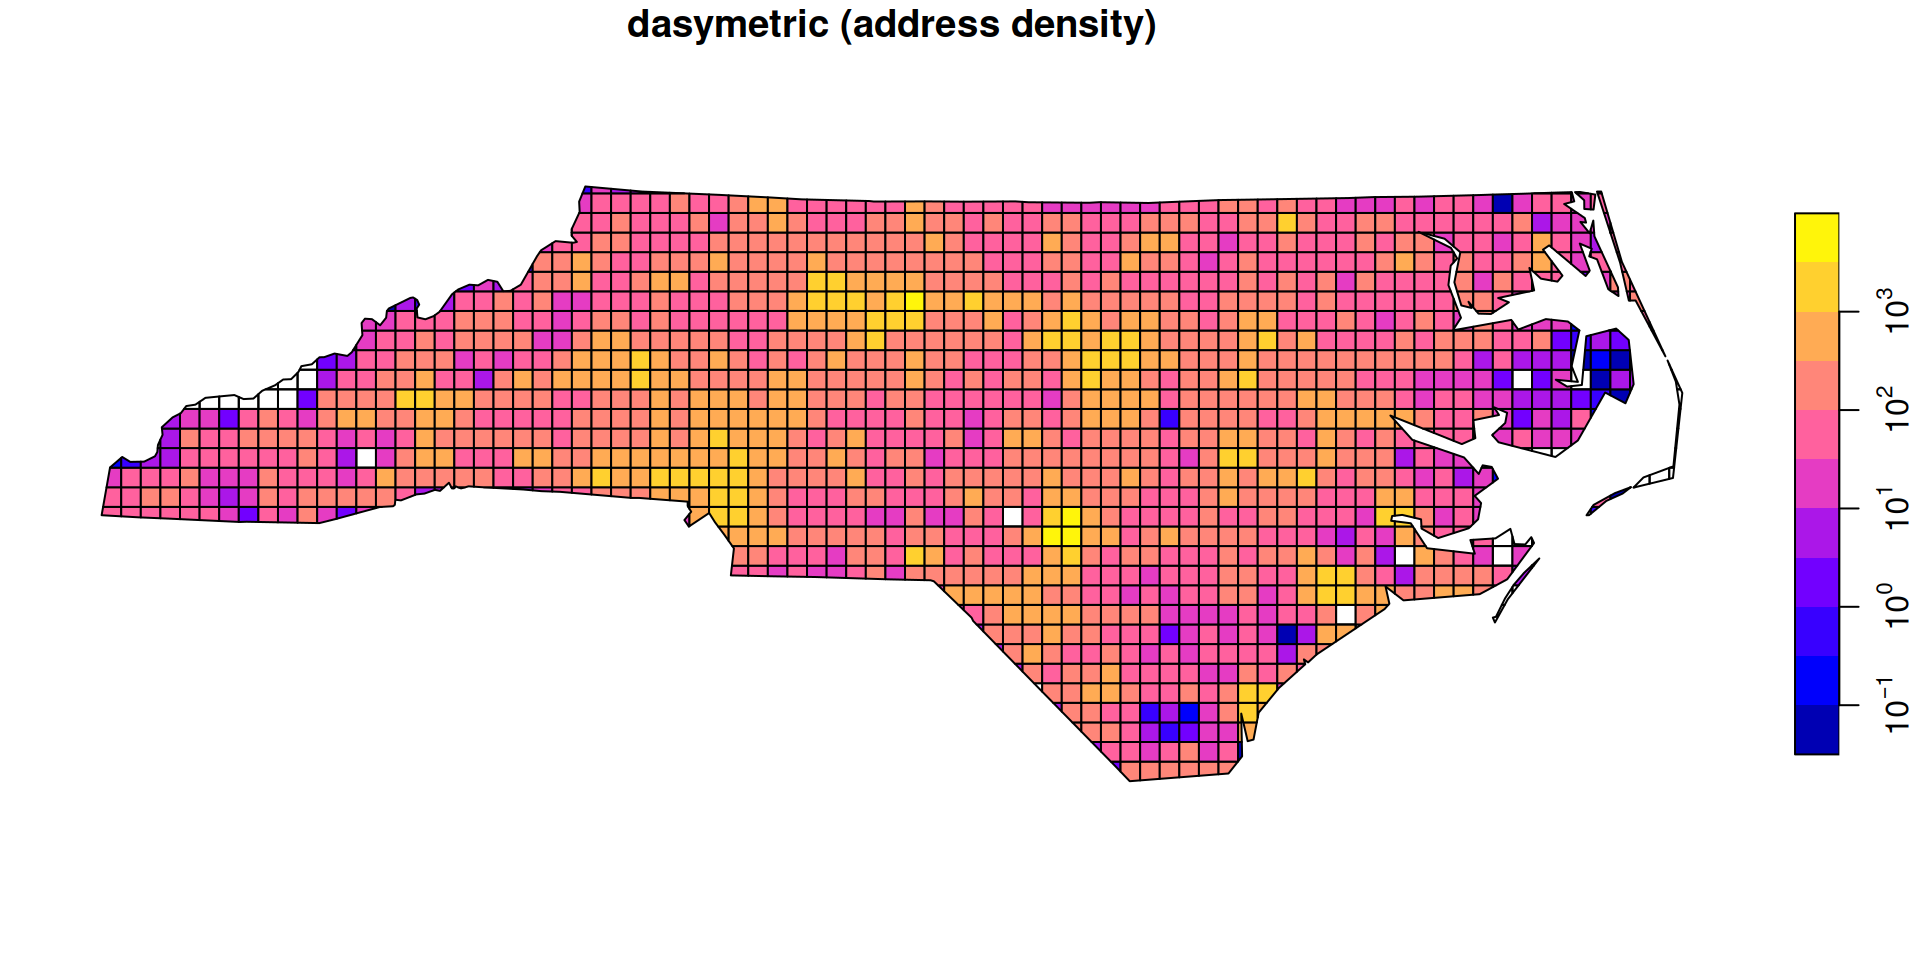
  • Improve accuracy by using ancillary data that captures spatial heterogeneity within the source zone.
  • Classic example β€” population redistribution:
    1. Overlay source zones with land use / building footprint data
    2. Assign population only to residential areas
    3. Intersect with target zones and sum
  • The more precise the ancillary layer, the more accurate the result.
  • In R: pass the ancillary layer as weights = to st_interpolate_aw().
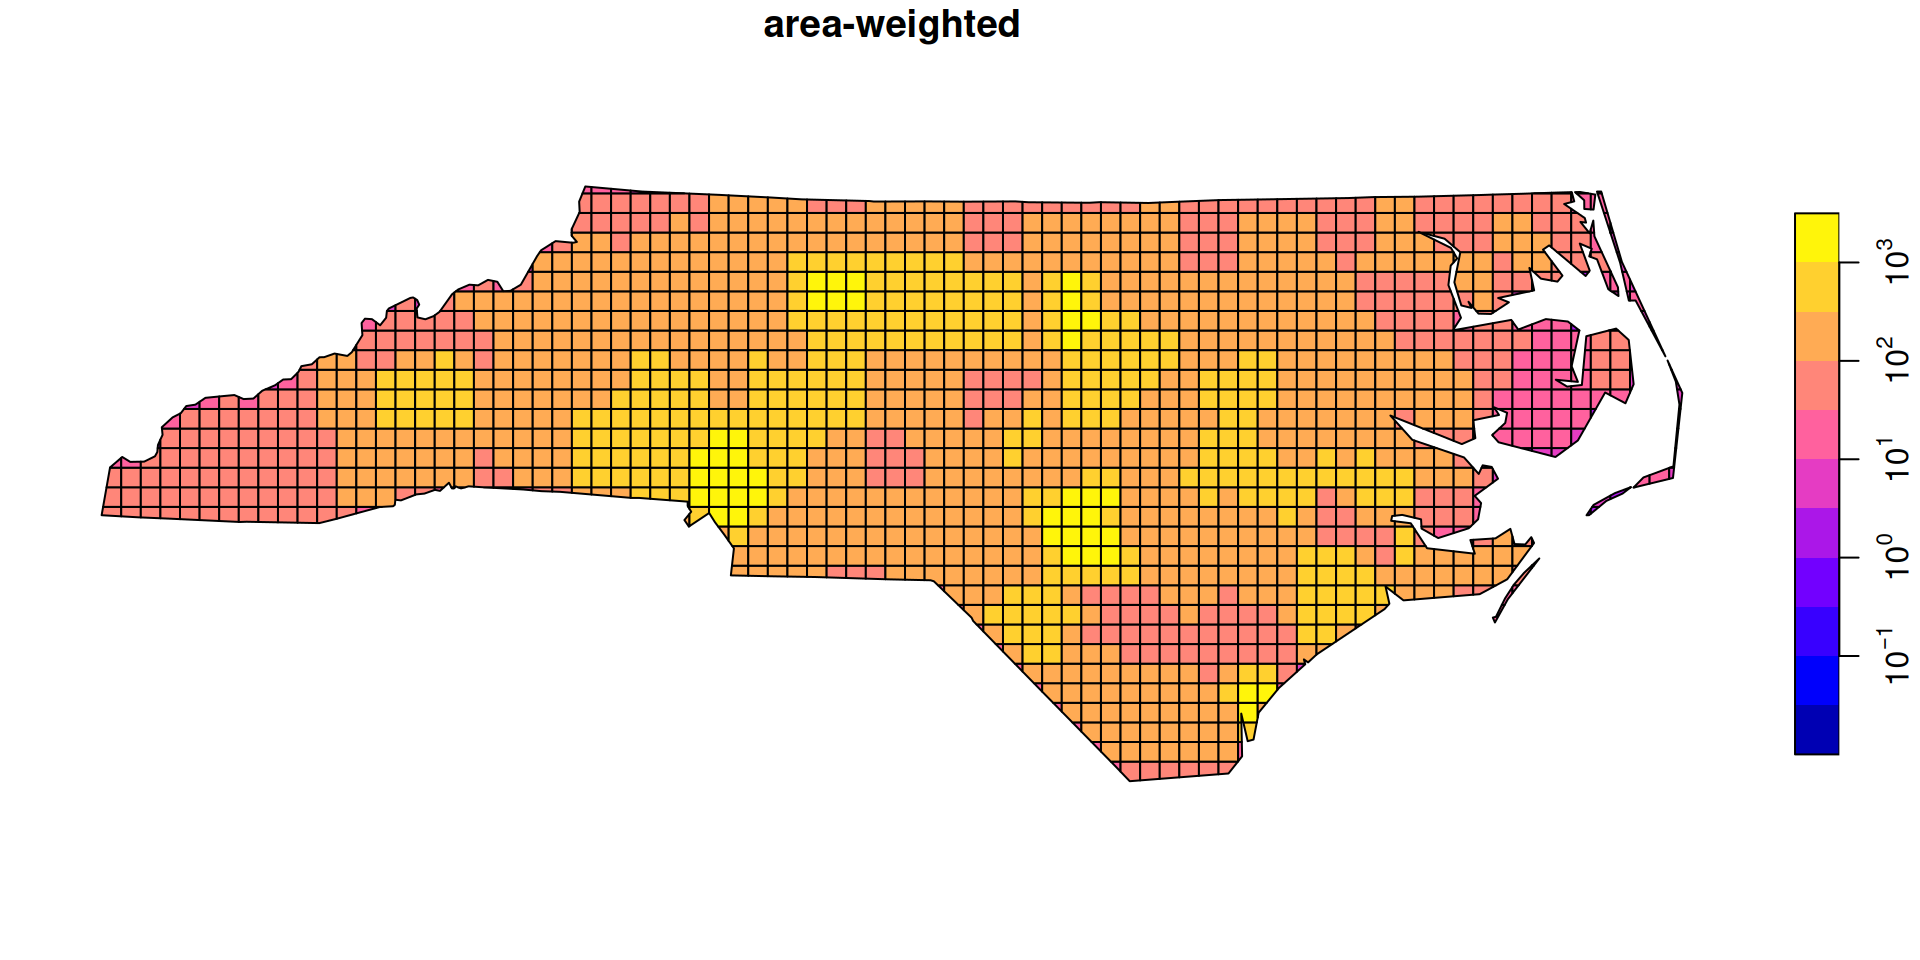
  • Example from r-spatial.github.io/sf

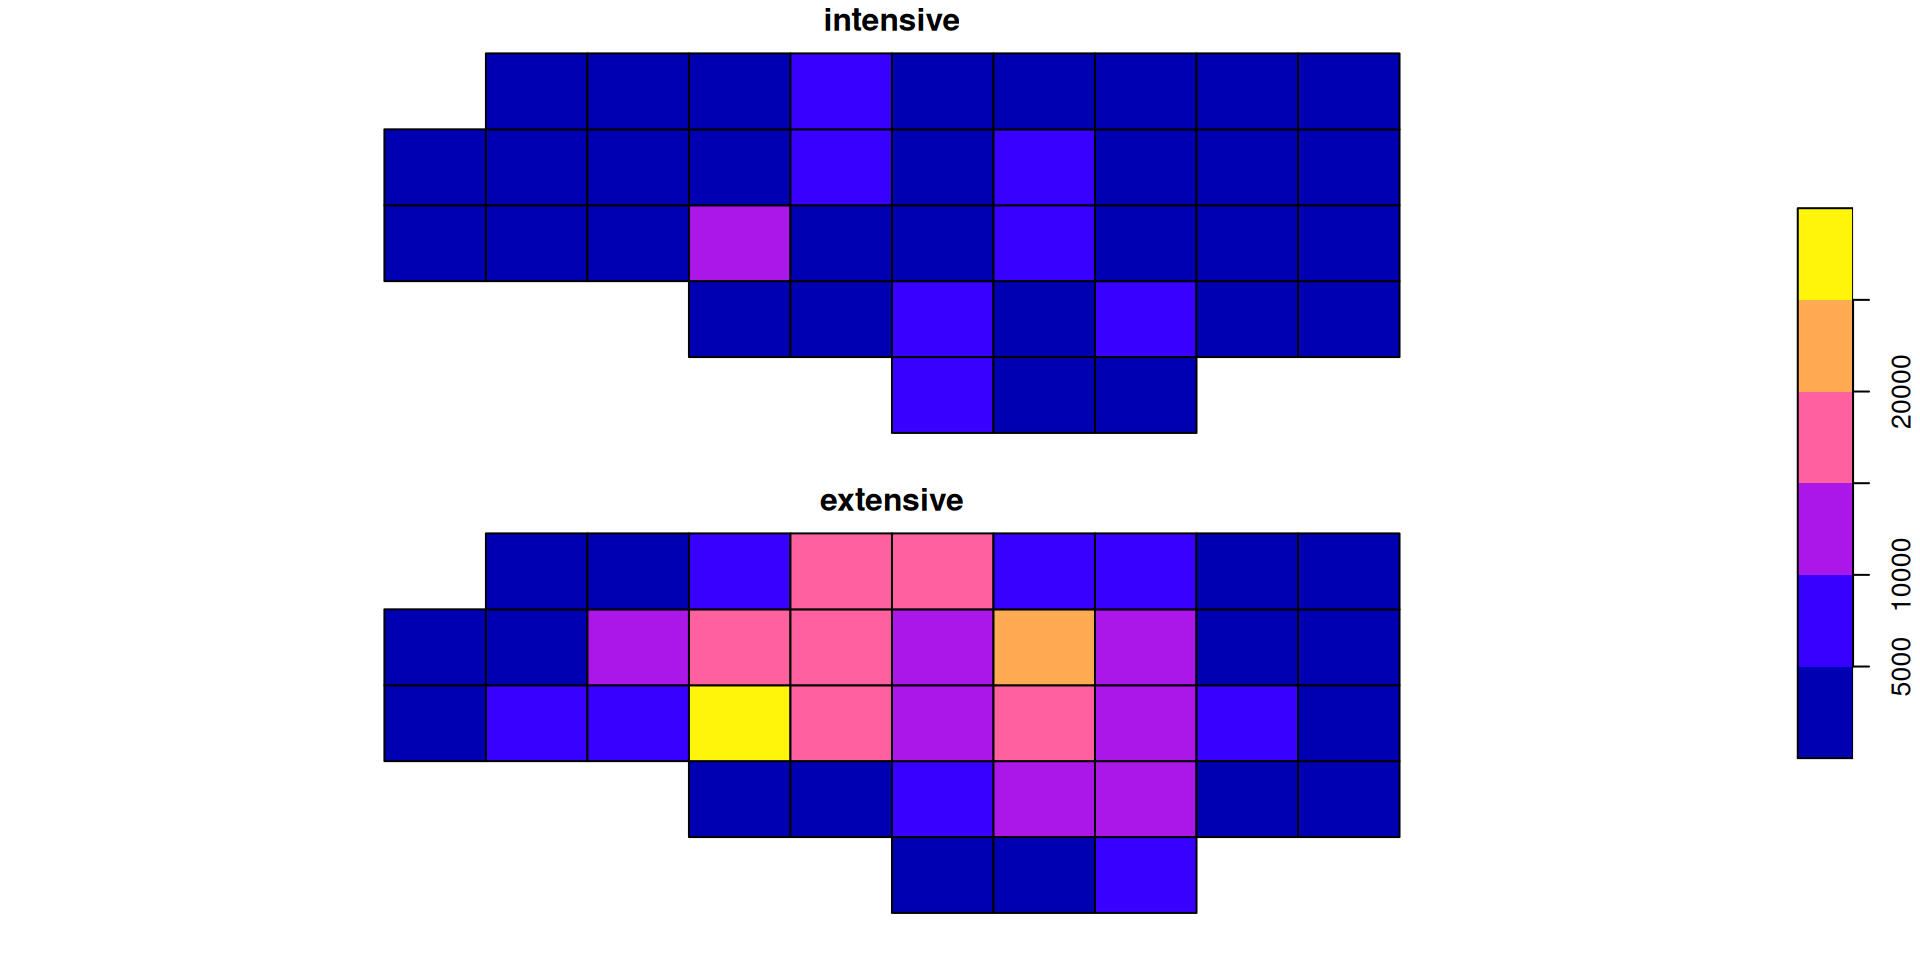
Intensive vs extensive β€” side by side

nc <- st_read(system.file("shape/nc.shp", package = "sf"), quiet = TRUE)
g  <- st_make_grid(nc, n = c(10, 5))

a1 <- st_interpolate_aw(nc["BIR74"], to = g, extensive = FALSE)
a2 <- st_interpolate_aw(nc["BIR74"], to = g, extensive = TRUE)
sum(a2$BIR74) / sum(nc$BIR74)   # mass preserved β†’ 1
[1] 0.9999998

Dasymetric mapping in R

grd.addr <- read_sf(system.file("gpkg/grd_addr.gpkg", package = "sf"))
nc2 <- st_transform(nc, st_crs(grd.addr))
st_agr(grd.addr) <- c(ones = "constant")
st_agr(nc2)      <- c(BIR74 = "constant")

bir0 <- st_interpolate_aw(nc2["BIR74"], to = grd.addr, extensive = TRUE)
bir1 <- st_interpolate_aw(nc2["BIR74"], to = grd.addr, extensive = TRUE,
                           weights = "ones")
sum(bir1$BIR74) / sum(nc2$BIR74)   # mass preserved β†’ 1
[1] 1